Analysis of Factors Affecting Fiber Linear Density Testing
Think of linear density as the “pulse” of fiber production. It’s the weight-to-length ratio that tells you if your process is actually stable. If you get it wrong here, you’re going to see the consequences later in uneven dyeing or weak spots in the weave.
Contents
Test Standard
The industry standard, GB/T 14335, offers two paths, but they aren’t created equal. The old-school bundle-cut method is purely about averages. You align a clump of fibers, chop them, and weigh the middle section. It’s fine for a quick check, but it hides the “messy” details. You can’t see the outliers or the unevenness between single strands. It’s also notoriously sensitive—a technician having an “off” day can easily skew the numbers.
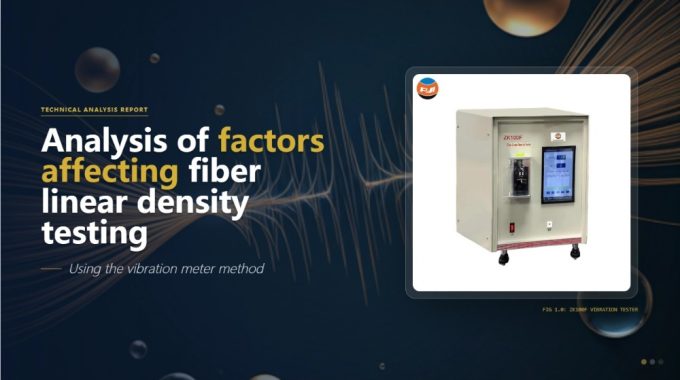
The fiber fineness tester is the real upgrade. It’s far more granular, giving you the specifics of each individual strand. It’s the only way to catch non-uniformity before it becomes a problem. When you sync it with a strength tester, you aren’t just getting a weight; you’re getting a complete stress-strain map of the fiber’s physical limits. We’ve spent some time digging into what actually affects these vibration readings—specifically with polyester—to make sure the data we’re getting is actually as precise as the machine claims.
Test principle
The vibration method for determining fiber linear density utilizes the principle of string vibration. A fiber under tension is clamped and confined within a length between upper and lower blades, subjected to force-induced vibration. According to vibration theory, the natural frequency of the fiber string vibration is:
f = 1/2L (T/P)^(1/2) [1+d^2/4L (Eπ/T)^(1/2) ]
Where, f – natural frequency of fiber string vibration, Hz;
L – vibration length of the fiber, cm;
P – linear density of the fiber, g/cm;
d – diameter of the fiber, cm;
T – tension on the fiber, g·cm/s²;
E – Young’s modulus of the fiber, cN/dtex. When the ratio of fiber diameter d to length L is very small, the natural vibration frequency of the fiber can be expressed as:
f = 1/2L √(T/P)
Then the linear density of the fiber is:
P = T/4L²f²
After unit conversion, the linear density unit is converted to dtex (dectex), and the tension T unit is converted to cN (centine Newtons). When the instrument’s vibrating string length L is fixed at 20 mm, the linear density of the fiber is:
P = 6.25 * (10)^7 T/f^2
This formula is the basic formula for the design of a vibrating linear density meter. Given the tension T, by measuring the fiber’s vibration frequency f, the linear density of the fiber can be calculated using this formula.
Result and discussion
Instrument stability test
If you’re using a vibratory tester, you’re essentially betting on the stability of a string’s frequency. Since the tension is a constant, the accuracy of your dtex reading lives or dies by how steady that vibration is. We put this to the test to see if the hardware was actually reliable or just sensitive.

The results for a single fiber were rock solid. After 30 consecutive runs on a 4.48 dtex sample, the variance was a negligible 0.04 dtex. That’s a 0.27% swing—well within the margin of error. When we moved to standard polyester batches, the averages stayed tight, drifting by maybe 0.03 dtex at most.

The interesting part is the “spread” in the batch data. When you see a wide gap between the thickest and thinnest fibers, it’s easy to blame the equipment. But our tests show the machine is steady; the variation is just the reality of the material. Keep the lab doors shut to block out drafts, and the frequency stays locked in. For anyone worried about precision, the tech holds up—any inconsistencies you’re seeing are almost certainly in the fibers, not the sensors.
The impact of the number of tests on the test results
In a perfect world, every fiber in a batch would be identical. In reality, every tiny hiccup in the machinery or a temperature swing in the melt creates a slight deviation in density. The trick is finding the “point of diminishing returns” for your sample size—where you’ve done enough tests to be accurate, but not so many that you’re wasting a Tuesday afternoon.
Our testing on polyester samples suggests that the magic number is around 30. Once you pass that threshold, the average density stabilizes and the CV stops dropping. For standard, stable production, n=50 is plenty. It gives you a reliable snapshot without overcomplicating the workflow. However, if you know a batch is “noisy” or the initial CV is high, you have to push that number higher. There’s no shortcut for a bad batch; you just have to do the work to find the real average.

The effect of humidity on test results
In a vibratory test, you’re essentially measuring how a string “sings.” The frequency depends on the fiber’s thickness and its internal stiffness (modulus). Naturally, moisture throws a wrench into this. Water doesn’t just add weight; it physically swells the fiber and changes how it reacts to tension.
We decided to push this to the limit. We took regular polyester and some high-absorbency specialty fibers and compared them in two states: perfectly conditioned (standard lab humidity) and “wet” (soaked in distilled water and blotted).

It turns out that moisture is a non-issue for the vibration method. Whether you’re testing bone-dry polyester or a high-absorbency blend that’s been soaked through, the density readings come out the same.
The physics behind this is actually pretty interesting. Yes, a wet fiber swells, and yes, its diameter and modulus (E) technically change. But because a textile fiber is so incredibly long relative to its thickness, that swelling is mathematically irrelevant. It’s like adding a coat of paint to a mile-long cable; it doesn’t change how the cable vibrates under tension. The frequency (f) stays locked in because the change in volume is just too small to fight the tension. You get the same dtex result whether it’s a humid summer day or a dry winter morning in the lab.
The impact of sampling uniformity on test results
A vibratory tester is only as good as the sample you feed it. You’re using a tiny fraction of a batch to define the whole thing, and as the numbers in Table 2 prove, there’s a lot of “noise” between individual fibers. If you grab an uneven sample, your final average is essentially a coin flip.
Consistency here isn’t about the machine; it’s about the person pre-sorting the fibers. You can’t just pull from one spot and expect a real result. To get data that actually reflects the production line, you have to be militant about how you pick those fibers. Following the GB/T standard for sampling isn’t just a box to tick—it’s the only way to keep the individual variations from trashing your accuracy.
Conclusion
The secret to getting a vibratory tester to behave is all in the environment. If you can kill the drafts and keep the table from shaking, the sensor is rock solid. It doesn’t matter if the fiber is thick or thin—as long as you’ve got the right tension clips, the precision is there.
For a standard, steady production line, 50 fibers is the “sweet spot” for your sample size. If the batch looks messy, just add more tests until the average settles. But don’t skip the calibration. You need that K-value correction to ensure your digital results stay in sync with the traditional weighing standards.
The real weak point in the whole process is the human element: sampling. If you aren’t militant about picking a representative cross-section of fibers, even the best sensors won’t save the data. But once you’ve mastered the sampling, this is easily the most efficient way to work. It’s fast, it ignores humidity, and it gives you a deep dive into both the average dtex and the distribution of the raw stock—all in one pass.


