Analysis of Differences in Fiber Content Testing Standards: AATCC 20 vs. GB/T 2910
The United States is the primary export destination for Chinese textile and apparel products and the world’s largest consumer market for textiles. Products exported to the U.S. must comply with local laws and regulations; in particular, there are strict U.S. labeling statutes governing fiber content that guide manufacturers and retailers in accurate fiber labeling. Ensuring label accuracy begins with the use of correct testing methods. This article compares and analyzes the differences between Chinese and U.S. fiber content testing methods, providing relevant information to domestic manufacturers and trading companies so they can accurately analyze fiber content and apply labels based on the target export market, thereby meeting market requirements.
1. Characteristics of U.S. Standards for Fiber Content Testing
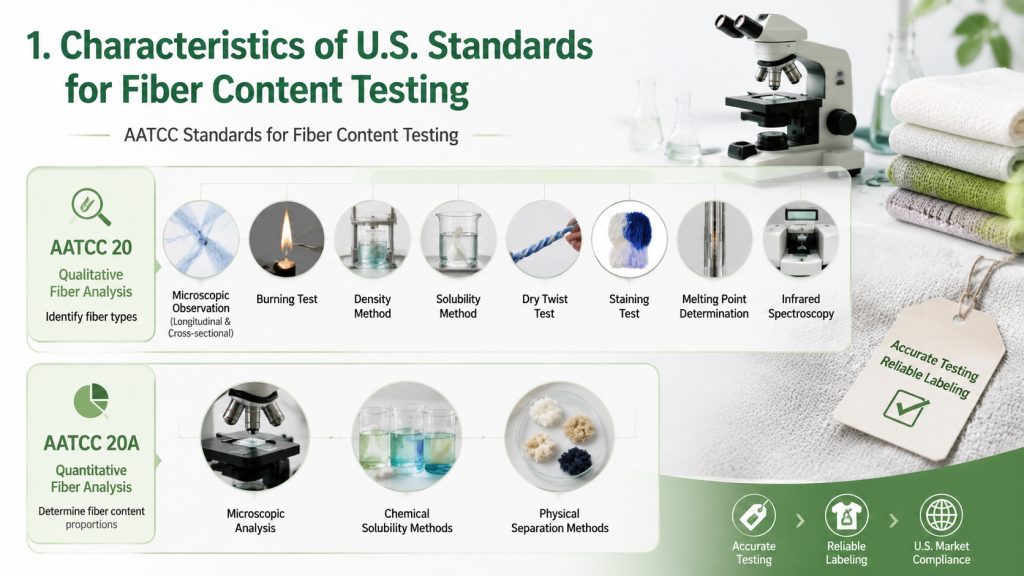
The American Association of Textile Chemists and Colorists (AATCC) holds significant authority in the field of textile testing standards. The AATCC test methods established for textiles cover a wide range of areas, including fiber composition analysis, colorfastness testing, and the physical properties of fabrics after laundering. AATCC standards are among the most widely applied testing standards for textile products entering the U.S. market.
Regarding fiber content testing, AATCC standards primarily comprise two methods: AATCC 20 for qualitative fiber analysis and AATCC 20A for quantitative fiber analysis.
Qualitative fiber analysis is primarily used to identify fiber types; testing methods include microscopic observation (longitudinal and cross-sectional), the burning test, density method, solubility method, dry twist test, staining test, melting point determination, and infrared spectroscopy.
AATCC 20A is primarily used for the quantitative analysis of fiber content; testing methods include microscopic analysis, chemical solubility methods, and physical separation methods.
2. Differences between Chinese standards and US standards
In China, fiber content testing for textile products is based on FZ/T 01057—2007 *Test Method for Identification of Textile Fibers* and GB/T 2910 *Textiles—Quantitative Chemical Analysis*. In addition, industry associations and relevant bodies have developed standard methods for specific products, such as FZ/T 01095—2002 *Test Method for Fiber Content of Spandex Products*, GB/T 16988—1997 *Determination of Content of Mixtures of Specialty Animal Fibers and Sheep’s Wool*, FZ/T 30003—2009 *Quantitative Analysis Method for Bast Fiber/Cotton Blended Products*, and FZ/T 01026—2009 *Quantitative Chemical Analysis—Four-Component Fiber Mixtures*.
2.1 Methods for qualitative analysis of fibers
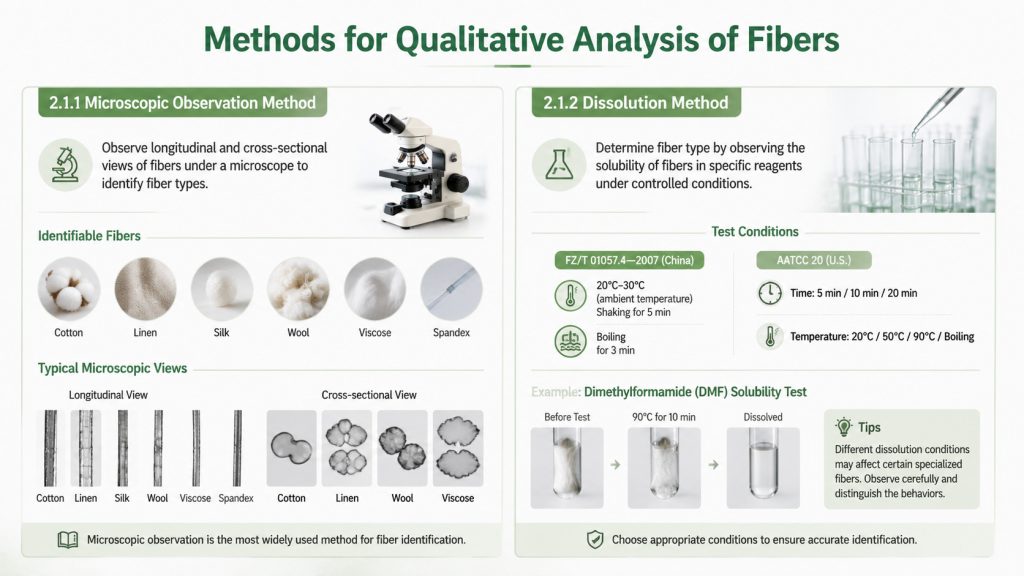
Among all testing institutions, microscopic observation and solubility testing are the most widely used methods for fiber identification; for specific fiber types, supplementary techniques such as the burning test and infrared spectroscopy are also employed. Other methods are rarely used in practice due to limitations regarding accuracy or operational feasibility. The following is a brief overview of the procedures and differences associated with several qualitative analysis methods.
2.1.1 Microscopic observation method
Microscopic observation utilizes a biological microscope, allowing technicians to make a preliminary identification of fiber types by directly examining the fibers’ longitudinal and cross-sectional views.
An experienced technician can identify natural fibers—such as cotton, linen, silk, and wool—as well as certain chemical fibers, such as viscose and spandex, using this method.
Standards such as AATCC 20 (*Fiber Analysis: Qualitative*) and FZ/T 01057—2007 (*Test Method for Identification of Textile Fibers*) not only provide verbal descriptions of the longitudinal and cross-sectional morphology for each fiber type but also include numerous images to facilitate a more intuitive understanding.
2.1.2 Dissolution method
China’s industry standard FZ/T 01057.4—2007, *Test Method for Identification of Textile Fibers—Solubility Method*, mandates a uniform procedure of either shaking at ambient temperature (20°C–30°C) for 5 minutes or boiling for 3 minutes before observing the sample’s solubility. In contrast, the solubility test in AATCC 20 specifies three different durations—5, 10, and 20 minutes—based on the varying ease with which different fibers dissolve; regarding temperature, it prescribes not only ambient temperature (20°C) but also 50°C, 90°C, and boiling.
For instance, the confirmatory solubility test using dimethylformamide requires observation after the sample has been treated at 90°C for 10 minutes. Because the dissolution conditions differ, the dissolution behavior of certain specialized fibers may vary; testing personnel should therefore observe carefully and distinguish between these behaviors.
2.1.3 Dry twisting method
AATCC 20 employs the dry-twist method for the preliminary identification of bast fibers. A bundle of parallel fibers is immersed in water; one end is held while the other free end is positioned facing the observer. Upon heating with hot air from an electric heater, flax and ramie fibers rotate clockwise as they dry, whereas hemp and jute fibers rotate counter-clockwise.
2.2 Methods for quantitative analysis of fibers
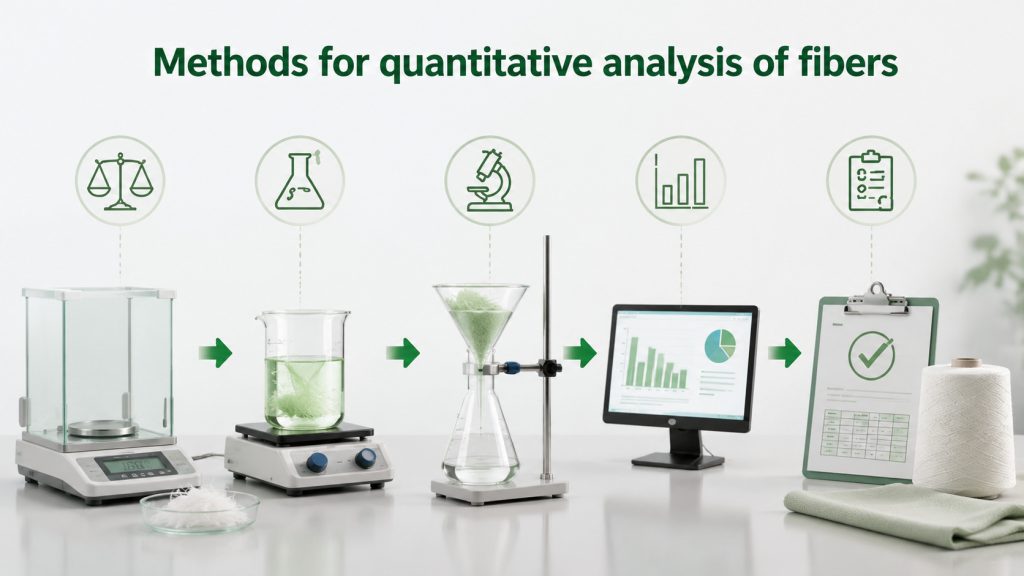
With the exception of a few specific procedures, GB/T 2910—2009 adopts the methods from the latest version of ISO 1833; it differs significantly from the US standards system.
The US standard AATCC 20A covers moisture content, removal of non-fibrous matter, and methods for determining fiber content via manual separation, chemical analysis, and microscopic analysis.
In contrast, China has specific standards corresponding to different fiber quantitative analysis methods. Particular attention must be paid to the choice of method when conducting domestic fiber content analysis: GB/T 2910 covers quantitative chemical analysis (with manual separation methods provided in the appendix), while GB/T 16988 addresses microscopic analysis for animal fibers, among others.
2.2.1 Quantitative chemical analysis of fibers
AATCC 20A specifies eight chemical analysis methods: the 100% acetone method, 20% hydrochloric acid method, 59.5% sulfuric acid method, 70% sulfuric acid method, alkaline sodium hypochlorite method, 90% formic acid method, dimethylformamide method, and dimethylacetamide method.
In contrast, GB/T 2910 provides 23 chemical analysis methods, encompassing all the test methods found in AATCC 20A.
This article analyzes the differences between the two methodological systems regarding sample preparation, reagent selection, testing procedures, and data processing.
Sample preparation (see Table 1)
| Step | AATCC 20A | GB/T 2910 |
| Sampling | 0.5 g – 1.5 g | At least 1 g |
| Specimen preparation | Cut into pieces no larger than 3 mm | Cut into pieces of approximately 10 mm |
| Drying temperature | 105°C – 110°C | (105 ± 3)°C |
| Drying time | At least 1.5 h | No less than 4 h, no more than 16 h |
| Cooling | Cool to room temperature | No less than 2 h |
| Weighing | Accurate to 0.1 mg | Accurate to 0.0002 g |
| Constant mass requirement | Difference between two measurements within ±0.001 g | None |
Table 1 Comparison of sample preparation methods
Although the specifications regarding sample weight differ, practical experience shows that the sampling requirements of both standards ensure the representativeness and accuracy of the test results.
Regarding sample weighing, AATCC explicitly requires samples to be dried to a constant mass and provides clear criteria for defining that state. While GB/T 2910 achieves the practical equivalent of constant mass by employing a sufficiently long drying time, the AATCC 20A method offers greater operational practicality.
2)Reagent Selection
In the process of conducting the same fiber content analysis, there are both similarities and differences between AATCC and Chinese standards regarding the choice of reagents for the dissolution step (see Table 2).
| Blend Type | AATCC 20A | GB/T 2910 |
| Acetate and other fibers | 100% Acetone | Acetone method |
| Polyamide and other fibers | 20% Hydrochloric acid / 90% Formic acid | Formic acid method |
| Viscose and cotton | 59.5% Sulfuric acid | Formic acid / Zinc chloride |
| Cellulosic fibers and polyester | 70% Sulfuric acid | Sulfuric acid |
| Protein fibers and other fibers | Sodium hypochlorite | Sodium hypochlorite |
| Acrylic, modacrylic, elastane, and other fibers | Dimethylformamide / Dimethylacetamide | Dimethylformamide |
| Polyurethane elastic fibers and other fibers | Dimethylformamide / Dimethylacetamide | Dimethylacetamide |
Table 2 Comparison of dissolution reagents for selected methods
3)Test program
The testing procedures required by the two standards differ; the most representative example is the chemical analysis method for viscose fiber and cotton (see Table 3).
| Procedure | AATCC 20A | GB/T 2910 Method 6 |
| Reagents | 59.5% Sulfuric acid | Formic acid/zinc chloride mixture |
| Liquor ratio | 1:100 | 1:100 |
| Test temperature | Ambient (15°C–25°C) | 40°C or 70°C |
| Dissolution time | 30 min | 2.5 h |
| Washing | Rinse 3 times with 10 mL 59.5% sulfuric acid; rinse with dilute sulfuric acid (1:19); rinse with water; neutralize with dilute ammonia; rinse with water; remove liquid by suction | Rinse with 20 mL of the 40°C solution; rinse with water at 40°C; neutralize with dilute ammonia; rinse with water; remove liquid by suction |
| Weighing | Dry, cool, and weigh | Dry, cool, and weigh |
Table 3 Comparison of chemical analysis procedures for viscose/cotton blended products
Since both viscose and cotton are cellulosic fibers, the chemical reagents used for dissolution can damage the cotton fibers; consequently, even minor variations in parameters such as temperature, duration, or agitation during the procedure can affect the final results.
4)Data processing
Regarding result calculations, AATCC 20A introduces a loss compensation factor only for viscose/cotton blends; no correction or compensation factors are applied in any of the other chemical analysis methods.
In contrast, GB/T 2910 provides mass loss correction factors for every test category; the reported results are calculated by applying the corresponding correction factors to the raw test data, thereby ensuring accuracy.
Chinese standards explicitly require that fiber content by weight be calculated using official moisture regain values. Although US standards do not explicitly mandate this, testing laboratories still incorporate official moisture regain values into their calculations.
Differences in official moisture regain values between the two standards systems may lead to discrepancies in results; therefore, it is crucial to select the correct moisture regain values during calculation. Table 4 presents a comparison of official moisture regain values for two typical fiber types.
| ASTM D1909 | GB/T 9994 | |
| Wool fiber | 13.6 | Knitted: 15.0 Woven wool fabric: 14.0 |
| Regenerated cellulose fiber | 11.0 | Viscose fiber: 13.0 Modal fiber: 11.0 Lyocell fiber: 10.0 Cuprammonium fiber: 13.0 |
Table 4 Comparison of official moisture regain values for wool and regenerated cellulose fibers (%)
2.2.2 Quantitative microscopic analysis method
The differences in microscopic analysis methods lie primarily in the calculation of results. For instance, under AATCC 20A, the densities of both wool and cashmere are taken as 1.31, whereas Chinese standards specify a density of 1.31 for wool and 1.30 for cashmere.
Regarding the calculation formulas, GB/T 16988 incorporates the standard deviation of fiber diameters to calculate the area, while AATCC 20A determines the area based solely on the fiber diameters.
2.3 Multi-component content analysis
China’s GB/T 2910.2 standard addresses the analysis of component content in multi-component mixtures; it details four dissolution procedures and incorporates mass loss correction factors into the calculations.
In contrast, AATCC 20A does not provide such detailed calculation and analysis methods. When performing multi-component content analysis, one must carefully select dissolution reagents and the order of dissolution based on practical experience to ensure that the chosen reagents do not damage the residual fibers, thereby avoiding any reduction in data accuracy.
3 Conclusion
In summary, there are significant differences between China and the United States regarding fiber composition analysis methods; testing agencies should select the appropriate testing method based on the product’s export destination.
Enterprises should be mindful of discrepancies between test results and Chinese national standards when exporting products to the U.S., and should create fiber labels that meet market requirements based on the test data.
Testing agencies should be thoroughly familiar with the relevant testing standards and strictly adhere to the specific procedures for each method during composition analysis to ensure the provision of accurate test data to enterprises.
Reference: *China Fiber Inspection* (2011.11) — “Analysis on Fiber Content Test Standard Differences between China and the United” If any copyright infringement is detected, please contact us.