
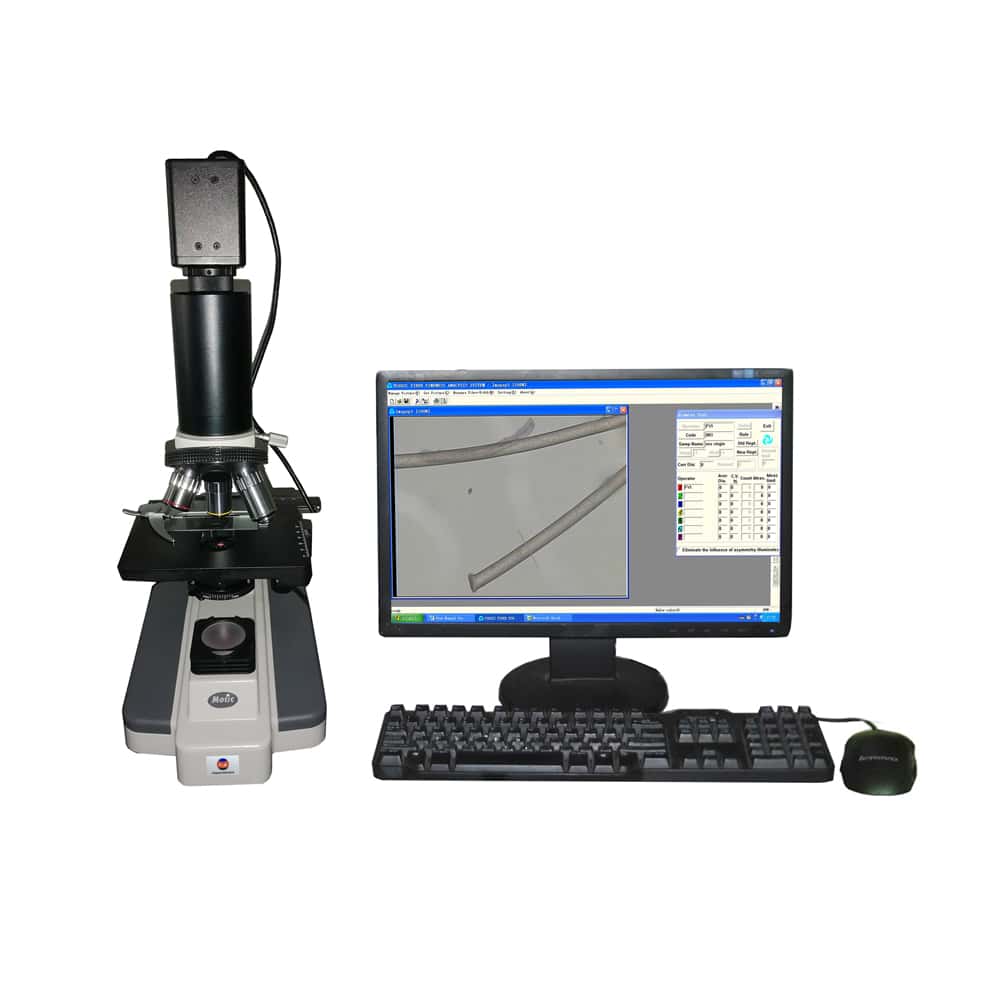
Microscopic Computerized Fiber Analysis System
We usually divide fibers into natural fibers and man-made fibers. Fiber samples are generally available in three forms:
① Loose fiber;
② A yarn may be contain one fiber type or multiple fiber types;
③ Woven or knitted fabrics may be constructed of yarns from one fiber type of form yarns made with multiple fiber types.
There two methods for fiber analysis: qualitative and quantitative.
- The qualitative test method describes physical, chemical and microscopic techniques for identifying textile fibers found in textile products;
- Quantitative: the procedures for the determination of fiber composition include mechanical, chemical, and microscopic methods.
In this blog, we’re going to introduce microscopic method.
The focus of this blog is:
- Scope of application of microscopic method;
- Use and function of microscopic method;
- Classifications of the YG002C series.
Contents
Scope of application of microscopic method
The microscopic procedure for fiber identification and fiber composition are applicable to all fibers and their accuracy depends to a considerable extent upon the ability of the analyst to ident the individual fibers present. The procedure is usually used for textiles containing two or more fiber types which cannot be separated readily by mechanical or chemical methods; microscopic examination is particularly useful in characterizing the natural fibers; e.g., mixtures of hair and wool and mixture of cotton, linen, hemp and /or ramie.
Use and function of microscopic method
The microscopic method has two test methods: Longitudinal Section method and Cross-Section method. Diameter and content items are used the longitudinal section method; Items that use the cross-section method are section experiment, shape factor in radius experiment and degree of hollowness experiment.
First, preparation of slides. Follow instructions with the Hardy type microtome to prepare the microscope slides. Insert a bundle of fibers or yarns into the slot. Slide the tongue into the slot to compress the bundle. Adjust the quantity of fibers for a tight package. Cut off both sides, and eject fibers from the microtome of the required snippet cutting length 200um (10 lattices) by turning the microtome wheel the required number of division for longitudinal section method, using a sharp razor blade, cut off this protruding fringe of fibers flush with the surface of the plate, then place a few drops of mineral oil on a clean slide and with a dissecting needle scrape the fiber sections onto the oil. Thoroughly disperse the fibers in the oil with the dissecting needle and cover with a cover glass. When for cross-section method, only need 20-40µm above the plate. Apply a drop of collodion and let dry about 5 min or until firm. Slice off the collodion and embedded fiber section with a sharp razor blade held at about 45°angle with the slot. Cut with a single stroke.

The microscope shall be calibrated before test by mean of a micrometer scale. used to make the system get the following proportional coefficient: each point in the image taken at a certain magnification corresponds is the length of the actual size. With the scale factor we can accurately get the measured object actual size and shape. For image systems that connect optical microscopes, each magnification should be calibrated separately. There are two methods of 0.01mm (automatic) and manual calibration.
Fibers with circular cross section
Select a 4x or 10x objective lens for longitudinal section slide. Place the slide prepared on the moveable stage on a microscope and observe the longitudinal of the fibers. Begin to count near either the upper or lower corner of the field and, as the slide is moved slowly across the field in the horizontal direction, identify and count all fibers; Using a correctly calibrated image analysis system measure the diameter of the individual fibers. After each trip across the field, move the slide 1-2 mm vertically and identify, count and measure the fibers as the field is again traversed. Repeat this procedure until the whole slide has been covered.

The specific method of fiber diameter in the image acquisition window is as follows:
- Move the mouse to a test of the fiber to be tested and click the left button;
- Move the mouse to another measurement of the fiber to be tested, and then click the lest button. The measured fiber diameter value is displayed in the “Data display window” of the console and input to the report.
- Repeat the above steps.

Fibers with noncircular cross section
Select a 20x objective lens for cross-section slide. Prepare a slide on the stage and adjust until a clear well-formed image appears on the monitor. Using correctly calibrated image capture board digitally cross-sectional images. Use the image analysis software to store the result and cross-sectional areas.

Select a 20x objective lens for cross-section slide. Prepare a slide on the stage and adjust until a clear well-formed image appears on the monitor. Using correctly calibrated image capture board digitally cross-sectional images. Use the image analysis software to store the result and cross-sectional areas.
Note:The procedures rely on the ability of a technician to identify and count.
The specific method of fiber content by cross-section in the image acquisition window is as follows:
- You can sketch the fiber section outline by clicking the “fold line” button. Right-clicking the mouse can stop sketching;
- Move the cursor to the closed region of the fiber to be measured after sketching section. Right-click the mouse, Select the fiber species and fill color for the section. Then click the “close” the button.

The image analysis software is powerful, and it is necessary to read the instructions repeatedly to familiarize yourself with the operation of each method. Measuring range is 2-200um, providing automatic fiber diameter measurement function; Newly developed personalized interface, automatic calibration ruler, the use of professional analysis software, data and reports to EXCEL output.
After the measurement is completed, enter the excel table, select the standard number used by the sample, and click statistics result again to get the report that meets the corresponding standard calculation. The average fiber fineness and standard deviation of the measurement by longitudinal section method; and the content of each fiber as percent can be obtained by longitudinal section method or cross-section method for blended samples.

Common fiber densities are already built into the software, and you can add fibers if you test new fibers.

Classifications of YG002C series
The YG002C series is divided into YG002C, YG002C1 and YG002C2. YG002C measures fiber diameter by longitudinal section method, YG002C1 measures fiber diameter and blend ratio by longitudinal section method, and YG002C2 includes longitudinal section method and constant section method. Please choose according to your needs.
:The-most-valuable-guidance-680x380.jpg.webp)
Comments are closed.
More examples and case studies could have been included to further support the arguments made in the blog.
I can’t emphasize enough how much I appreciate the author’s expertise and dedication in delivering this exceptional article.