
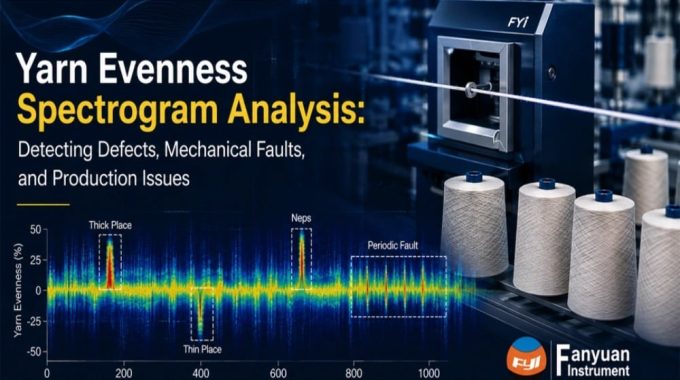
Yarn Evenness Spectrogram Analysis: Detecting Defects, Mechanical Faults, and Production Issues
Yarn evenness spectrogram analysis helps spinning mills detect periodic variations, mechanical faults, and recurring yarn defects. By examining spectrogram patterns and wavelengths, manufacturers can identify potential sources of irregularities and take corrective action. This supports effective quality control, reduces production issues, and helps maintain consistent yarn quality.
What Is a Yarn Evenness Spectrogram?
The evenness spectrogram is a graphical representation of the periodic variations along the length of yarn that is used in analyzing evenness. It is useful for detecting recurring unevenness that does not show up in simple evenness assessments.
The spectrogram shows variation by wavelength, and helps manufacturers identify if there are defects at regular intervals. Any peaks in the spectrum may reflect periodicity of the yarns that can be attributed to the irregularities of the drafting process or to problems with the rollers, spindles, gears or other components of the spinning process.
These patterns can be used to identify any potential mechanical or process issues, rectify the source of the problem, and enhance the production and consistency of the yarn. Learn about the Filament Evenness Tester here.
Common Spectrogram Patterns and Their Causes
The patterns seen on a yarn spectrogram may vary from one type of irregularity to another, depending on the type and origin of the irregularity. The knowledge of these patterns enables spinning mills to detect process or mechanical issues and decide where the mill should be visited.
Sharp Peaks
If a peak is sharply pointed and narrow, it is likely that there is a strong periodic variation at a particular wavelength. It could be connected to rotating parts, drafting rollers, gears, spindles, or other parts of machines that are moving at regular speeds.
Broad Peaks
A wide peak may suggest that the variations are distributed over a wide range of wavelengths (a broad periodic defect). They may be due to unstable drafting conditions, mechanical movement, or to process variations that are not associated with a single fixed frequency.
Harmonic Peaks
Several peaks at similar wavelengths can be due to harmonics of a basic periodic fault. These patterns are due to mechanical parts vibrating or to a recurring fault creating extra frequency components.
High-Intensity Periodic Peaks
A good peak at the given wavelength means that there is a clear regular fluctuation in yarn thickness. The wavelength may be compared with the operating conditions of the machines and/or the dimensions of the components to assist in a possible source identification.
Multiple Closely Spaced Peaks
If there are several peaks near each other, it could be more than one periodic source or it could be due to interaction between two or more parts of the machine. Additional testing and machine checks might be needed to ascertain the root cause. Read more: Automatic Evenness Tester.
Irregular Background Spectrum
If the spectrum is relatively diffuse with no strong peaks, it could be indicative of overall variation in the yarn, process instability, or measurement-related effects. It must be considered with other evenness and production information of the yarn.

Table of Common Spectrogram Patterns Detected by a Yarn Evenness Tester
| Spectrogram Pattern | Common Cause | What It Indicates |
| Sharp peak | Roller, spindle, gear, or drafting fault | Strong periodic defect |
| Broad peak | Process instability | Variable or less defined irregularity |
| Harmonic peaks | Mechanical vibration or gear issues | Repeating mechanical fault |
| High-intensity peak | Strong periodic variation | Significant yarn irregularity |
| Multiple peaks | Multiple component interactions | More than one defect source |
| Diffuse spectrum | General process variation | No dominant periodic fault |
Mechanical Fault Detection Through Yarn Spectrogram Analysis
Yarn spectrogram analysis is useful for spinning mills to identify periodicity in the yarns which is due to mechanical issues of the spinning equipment. If the yarn evenness tester shows peaks, these can indicate recurring variations which will help technicians to find and investigate components such as rollers, gears, spindles, and drafting systems.
Identifying Mechanical Faults
The amplitude and the wavelength of a spectral peak can give hints as to the origin of a mechanical fault. These patterns can be matched against machine speed, component size, and maintenance history to decide if any defect is associated with a specific component.
Locating the Source of Irregularities
A regularly recurring peak at a specific wavelength could signify a recurring mechanical problem. Knowing the relationship between the wavelength detected and the machine parts, spinning mills can locate the possible source and make specific inspections or maintenance of the machine.
Supporting Preventive Maintenance
A regular spectrogram analysis can be used to detect when mechanical problems are starting to occur before they cause major yarn quality problems. Early detection can help mills to plan maintenance, minimize unplanned downtime, and produce more uniform yarns.
Periodic Yarn Defects and Wavelength Analysis
Periodic defects in yarns are those that are repeated in the thickness variations in a regular manner. These variations can be detected using yarn evenness testers and are shown on the spectrogram as peaks. The distance between the peaks is called the wavelength and can give an idea of the distance between subsequent faults, which can help identify the probable source of the fault.
Understanding Wavelength
A shorter wavelength means the defect occurs over a shorter distance, and a longer one means that the defect is more spaced out. The machine component, roller size, and operating conditions can be compared to the wavelength that is detected to help the technician determine the probable cause.
Using Wavelength to Trace Defects
Just because the waved area indicates a fault doesn’t mean it has to be that particular fault. Rather, it serves as a good starting point for troubleshooting. By analyzing the periodic yarn defects using the spectrogram, Mills can take a more holistic approach and integrate machine inspection, production data, and maintenance records to help locate and correct the problem.
How Spinning Mills Use Spectrogram Data to Improve Production
The spinning mills utilize the spectrogram data to identify any recurring irregularities in the yarn and to see if there are any problems with the process or equipment. Quality teams can use the analysis of the peaks, ranges of wavelengths, and the intensity of the defect to identify the areas for further investigation.
Identify Production Problems
The results from the spectrogram tests are useful to operators who may not be able to see the periodic variations in the yarn without the spectrogram test. Results from different machines, lots, or production conditions can be compared to identify common production problems.
Support Machine Maintenance
If a regular pattern emerges for a machine component, the technicians are able to examine the appropriate rollers, gears, spindles or drafting systems. This enables maintenance to be focused as opposed to merely routine checks.

Improve Yarn Quality
By analysing the spectrogram in regular intervals, mills can keep track of the change in yarn uniformity and act on early detection of any issues that arise. This information, combined with other measurements recorded by the yarn evenness tester, ensures consistent quality yarns and helps minimize production downtime.
Optimize Spinning Processes
Yarn periodic variation data can also be used with spectrogram information to help mills optimize their processes to understand how periodic variation will be impacted by changes in the machine setting, raw material, or operating conditions. This will help to make better production decisions and process control.
Conclusion
Yarn evenness spectrogram analysis can be used to give the spinning mill valuable information on periodic yarn variations, mechanical faults, and possible problems in the process. An analysis of the spectrogram patterns and the wavelength characteristics can enable the manufacturer to determine where to investigate and take corrective action. When combined with the results from the yarn evenness test and machine data, spectrogram analysis can help to improve the quality control system, preventive maintenance, and yarn production.
For reliable yarn testing and quality control solutions, explore FYI Tester to learn more about yarn testing equipment and solutions.